The Evolution of the Electrical Market:

INTRO
The journey of electricity, transitioning from a scientific marvel to an indispensable service, has profoundly shaped our society. As the demand for electricity surges to support local economies and the world moves toward a low-carbon future, understanding the forces driving the evolution of the power market is crucial.
In the landscape of the United States, the power market of Texas stands out as a unique case study and offers us a peak into a future where renewables are not only possible but integral in the energy mix.
Explore the electrical landscape of the US and how renewables are reshaping generation
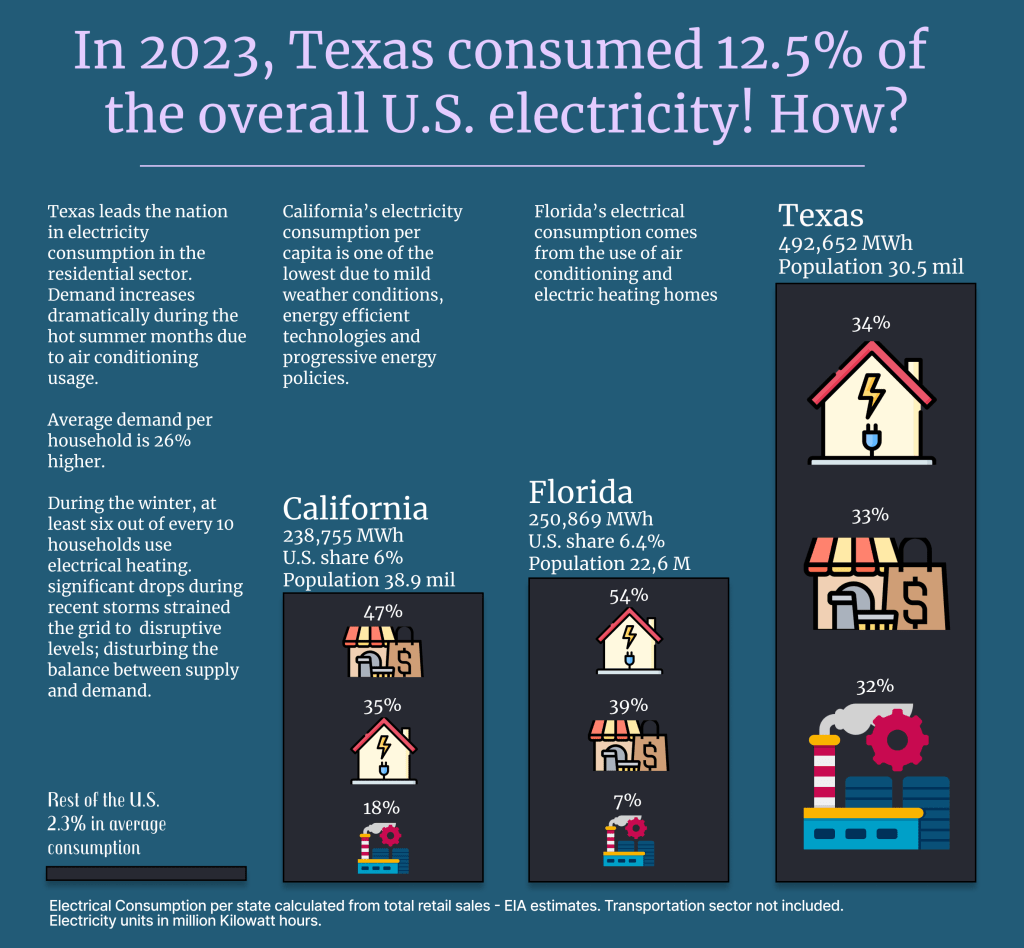
Why Texas?
Texas’s independence from the US grid, combined with its dominance as the undisputed leader in electricity consumption and generation, availability of natural resources and climatological conditions make
the state a power house and an interesting source of insight for current and future analysis.
America’s Power House
The western part of Texas sits on top of a 75,000 m2 area rich in hydrocarbons, called the Permian Basin. This basin is formed by a depression that over millions of years, accumulated and compressed organic deposits in sediments, turning them into rich deposits of gas, oil and potassium. Currently Texas is the biggest producer of oil and gas in the U.S.
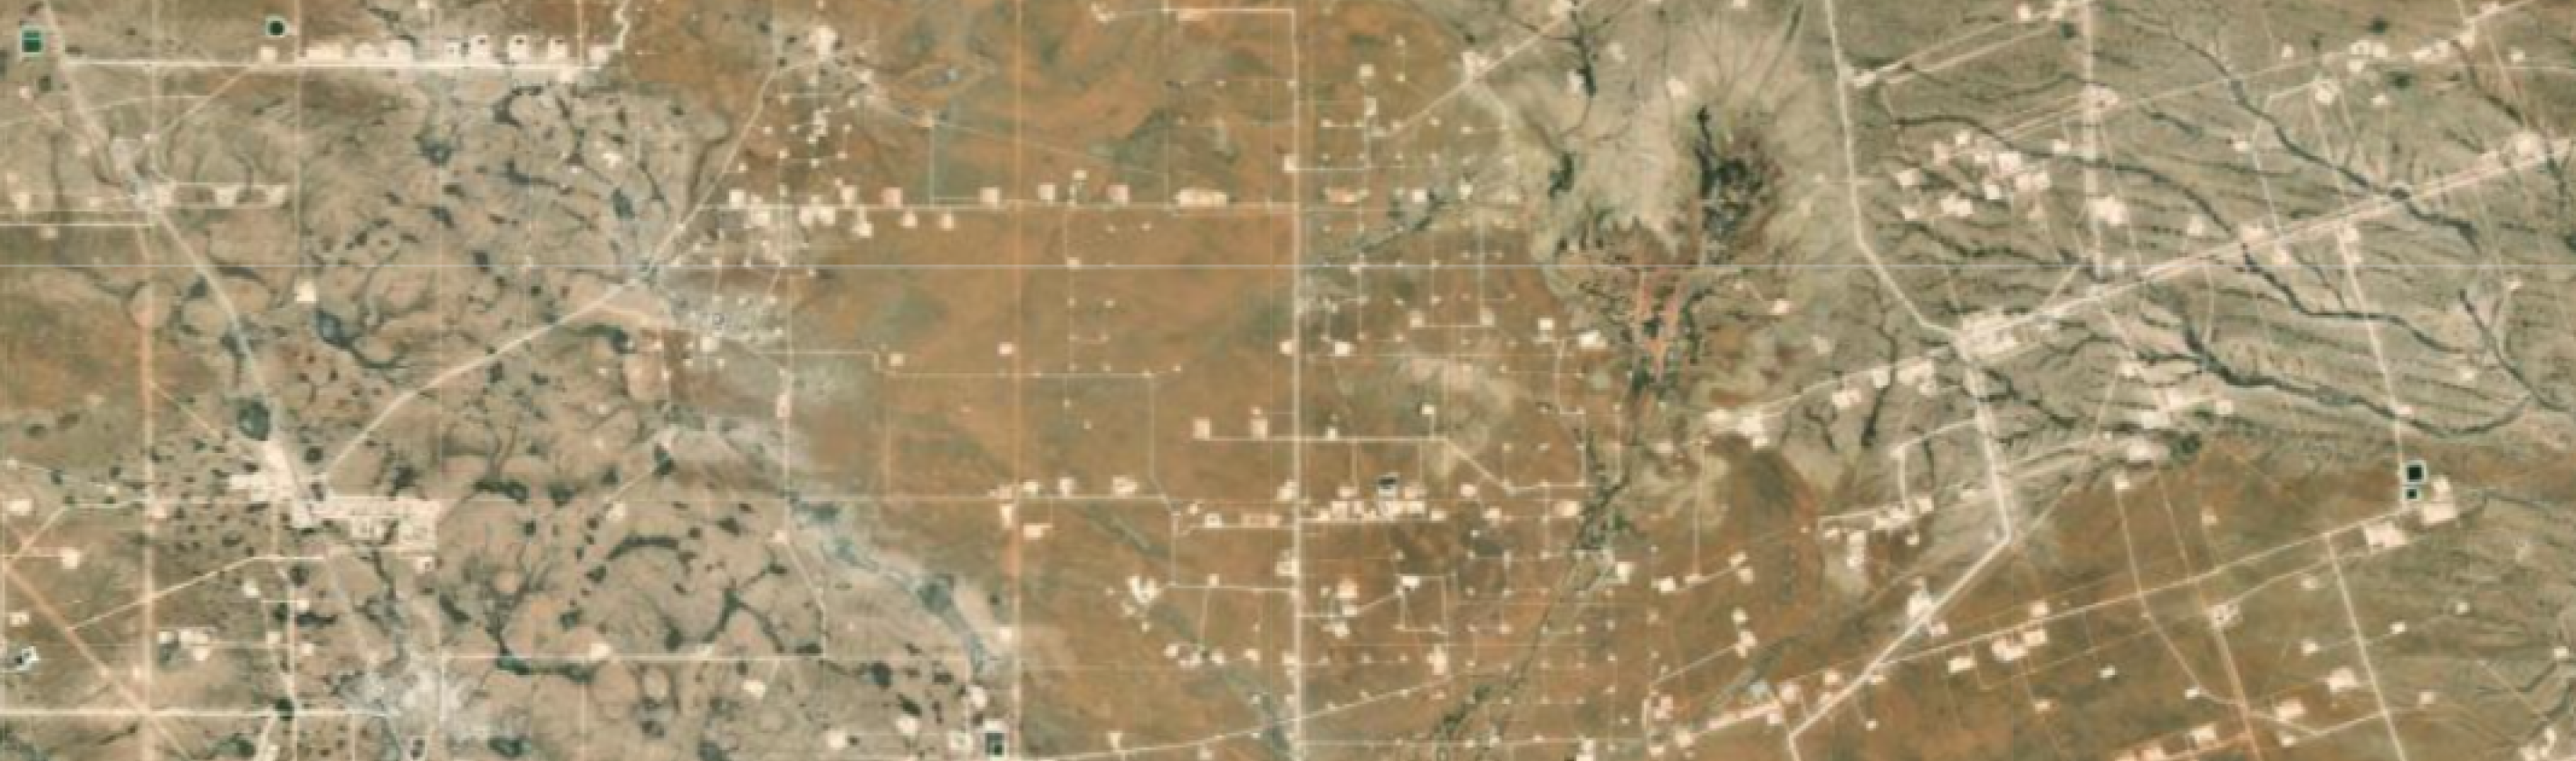
USGS -Permian Basin – West Texas Oil FIeld 2024
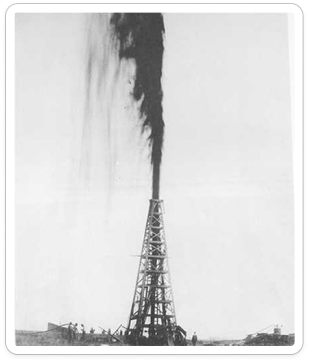
In the early 1900’s, Spindletop marked Texas’ first major oil gusher. By 1918, the discovery of vast natural gas reserves revealed Texas potential to produce energy, with gas also emerging as a byproduct of oil production.
Texas occupies 7th in coal reserves

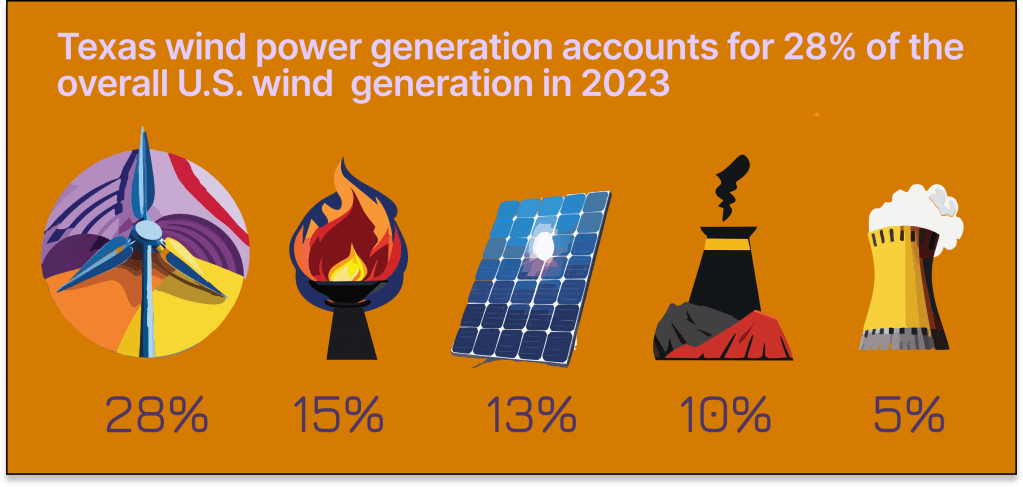
The great planes stretching from Canada to western Texas, are at the heart of America’s wind power potential. Pressure gradients descend eastward from The Rockies generating some of the strongest and consistent winds in the country.
The real time wind map created by FERNANDA VIÉGAS and MARTIN WATTENBERG at (http://hint.fm/projects/wind/) displays the prevalent wind patterns in the U.S.
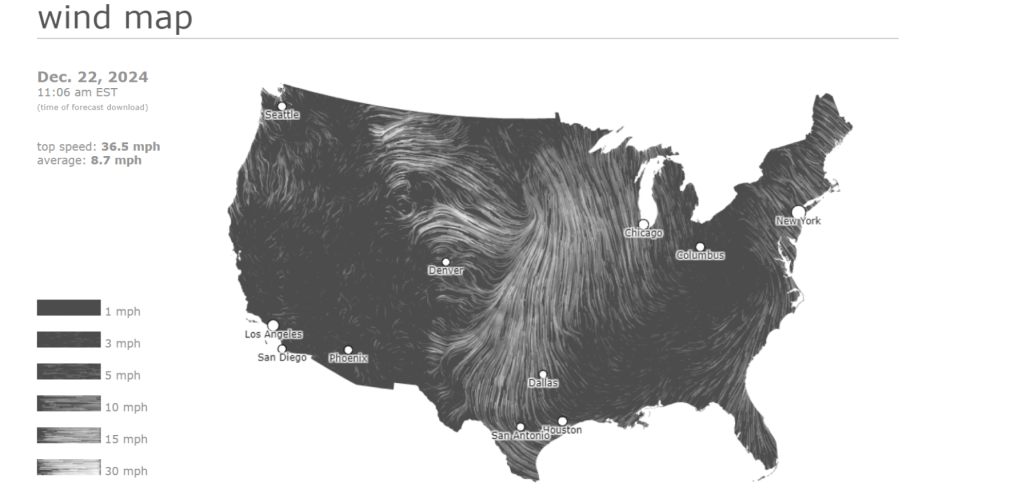
States in the middle segment produce between 25% and 61% of their total electricity from wind power
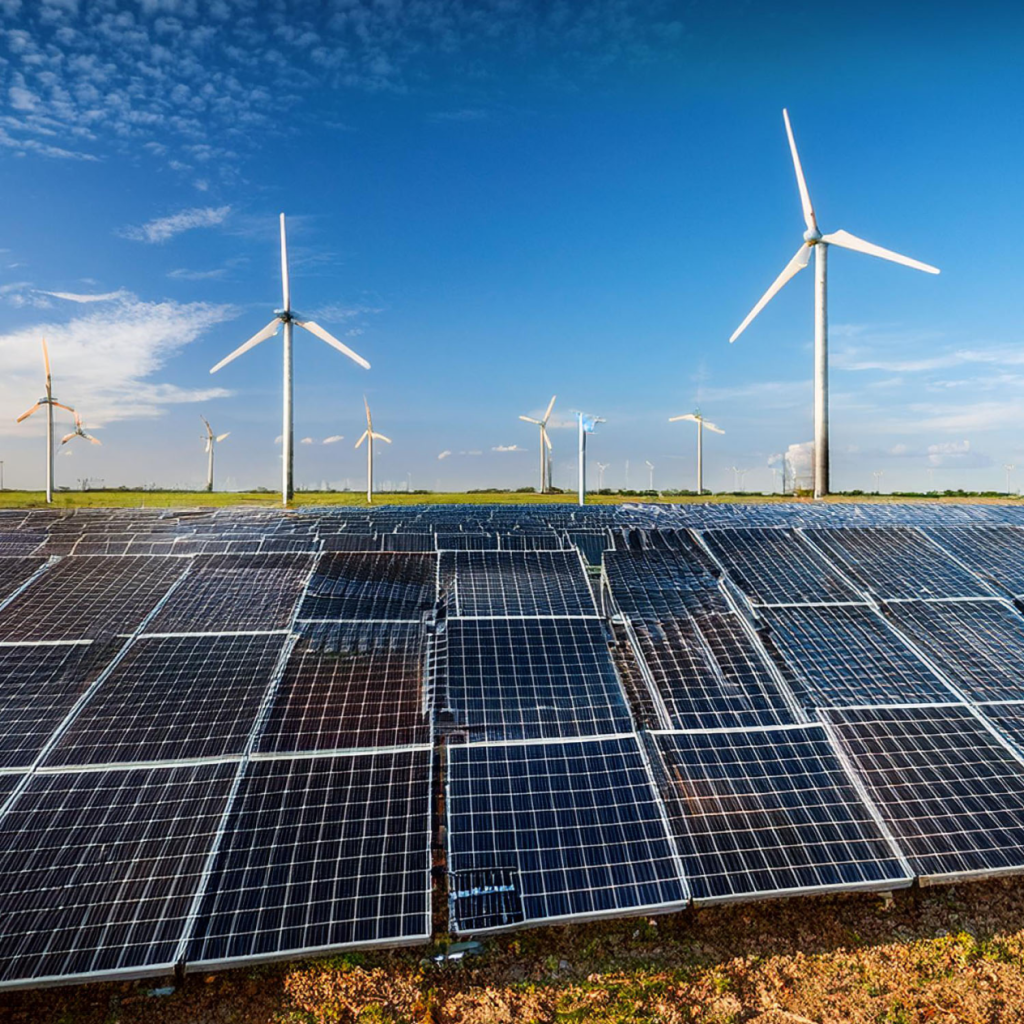
To the west the towering peaks of The Rockies act as a barrier to moisture on the Texan plains. Combined with hot and dry winds from the south, an arid landscape with clear skies offers ideal conditions for harnessing reliable and abundant solar energy
Remarkably, it only took Texas 20 years to become the nation’s leader in renewable energy with wind as the main source and sun second, after California.
Absolute values: generation growth over time
Relative values: generation growth over time
Generation from coal has been consistently dropping since 2016
Fossil gas displays a steady growth. In 2023, an amendment was passed to invest 10B to build “natural gas plants.
Wind generation surpassed coal’s. Wind development is strongly tied to federal and state investment policies.
Solar is still a small part of the overall generation (5.8%). Federal incentives and declining technology costs boosted its development.
The growth and evolution of Texas’ diverse energy mix is not only driven by resource availability but by a mix of factors that come into play. Let’s expose some of the factors that allowed renewables to grow so quickly.
The biggest selective pressure in the road to renewables depends primarily on state policy and government support


From Legislation To Impact

Senate Bill 7
As Governor of Texas, in 1999, G.W. Bush signed SB7 into law, deregulating the state’s power market. This legislation allowed the market to determine energy prices, encouraging competition among electricity generators and lowering consumer’s costs. Additionally, it established a Renewable Portfolio Standard, mandating the development of renewable projects and setting specific generation goals.
The bill also introduced the RECS, which established a trading program with the energy retailers for renewable credits
Senate Bill 20
Signed by then Gov Rick Perry in 2005.
Expanded RPS and Identified Competitive Renewable Energy Zones (CREZ) to build new wind and solar farms.
In 2007 after an investment of $7B, 2300 miles of transmission lines were built.
Provided funding for rural schools in CREZ areas.
Sets new goals to produce 5880MW from renewables. Goal was met by 2009.
Production Tax Credit
Provides Tax credits for generators of at least 2.75 cents/KW of renewables for a period of 10 years.
Inflation Reduction Act
Extended tax credits for renewables and new incentives for clean energy projects.
RPS funding did’t come directly from tax payers. It was financed through private investments and market based strategies such as Renewable Energy Credits (RECS). RECS administered by ERCOT, create a market in which electricity retailers are required to buy a certain amount of credits. This program was aided by the lowering in the cost of electricity through Federal investment and the great wind and solar potential in West Texas.
Curtailment
Curtailment of the power generation is a way to maintain the stability of the existing grid at a given point in time.

Despite all the recent milestones in renewable power development, growing political support for fossil gas, coal and oil threatens to stagnate new investments in solar and wind power. As natural selection demonstrates, survival is tightly linked to diversity. Systems that can draw upon a variety of resources will better adapt in response to Shocks or pressures. The same principle applies to energy. A smart grid reliant on diverse resources will have a better chance responding to supply chain disruptions, extreme weather and raising demand.
In 2022, during major winter storm Elliott, ERCOT’s management of electricity showed a strong tendency towards fossil fuels. With wind speeds of 30mph and an average wind generation of 11456 MW on the same month why the sudden drop to 2695MW? .
Extreme weather conditions in Texas were never a recurrent problem. For this reason wind turbines in Texas weatherized to work under such conditions. Dallasfed.org stated “Wind speeds fell to extremely low levels, and many of the few wind turbines producing power froze.” — Modern Turbines designs can withstand Temperatures of -22F—
Analysis Before the Storm
Graph above shows clear evidence of curtailment due to weather so what about earlier in the month when conditions weren’t as harsh?

The data from the storm clearly illustrates how Texas relies heavily on natural gas for its electricity supply. Earlier in the month, wind generation shows median values lower than the average indicating periods of high generation, during which curtailment likely occurred.
The standard deviation further underscores the variability in production, a trend corroborated by wind speed data. In contrast, while CC gas also exhibits a high standard deviation, it has a lower coefficient of variability compared to wind, demonstrating that CC gas production is significantly more consistent.
The wind potential earlier in the month, as indicated by wind speed data, reveals several instances where energy storage in the form of batteries could have played a crucial role while the turbines were offline. For example, the day before the storm recorded wind speed highs reaching up to 27 mph.
Unfortunately, ERCOT only publishes COP_HSL, a forecasted value, rather than HSL, which provides real-time data. However, COP_HSL can still offer valuable insights. However, the degree to which COP_HSL offers meaningful insights may vary depending on how accurately it reflects real-time conditions.

The survival of renewables in such a volatile environment will hinge on more than technical advancements or market trends. It will require a renewed political commitment. The path ahead will depend on prioritizing long term energy resilience over short term gains for fossil fuels.
